Customer segmentation machine learning
Customer segmentation machine learning Tutorial: This process is based on several groups of individual that share similarity in different ways, The will deploy customer segmentation under the notion that every customer has different requirements and require a specific marketing effort.
The company aims to gain an approach of the customer they are targeting.
The aim has a specific that should be tailored to address the requirements of every individual customer.
Companies gain an understanding of customer preferences as the requirements for discovering segments that would reap the maximum profit.
They can strategize marketing techniques efficiently and minimize the possibility of risk to their investment.
It is a method of dividing customers into a group that based on their shared characteristics such as age, gender.
It’s important for allocating company resources and targeting over the clients.
They influence sales and marketing decisions in organizations and allow marketers to tailor their campaigns to different target groups.
Personalized marketing and sales have an efforts based on well-segmented customer groups that have much higher conversion rates.
Some customer segmentation is
- The demographic Segmentation based on gender, age, occupation, etc.
- Geographic Segmentation which is based on country, state and local businesses may even segment by specific towns.
- Techno graphic Segmentation based on technologies, software, and mobile devices.
- Psychographic Segmentation based on personal attitudes, values, interests, habits, etc.
Implementation
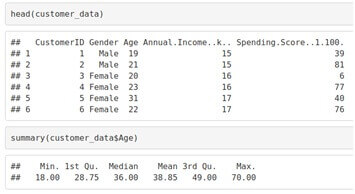
It will perform the data exploration and import packages for the role to read data.
Example
Customer_data=read.csv (“/home/dataflair/mall_customers.csv”)
Str (customer_data)
Name(customer_data)
Output:-
We use a pie chart to observe the ratio of male and female distribution.
Example
Pct=round (a/sum (a)*100)
Lbs=paste(c ((“Female”, “male”),””,pct,”%”,sep=””)
Library(plotrix)
Pie3D (a, labels=lbs,
Main=”pie chart Depicting Ratio of female and male”)
Output:-
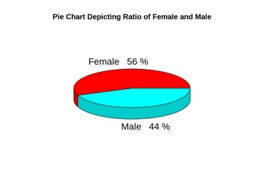
The percentage of females is 56% and the percentage of males in the customer dataset is 44%.
Example
Boxplot (customer_data$Age,
Col=”ff0066”,
Main=”Boxplot for Descriptive Analysis of Age”)
Output:-
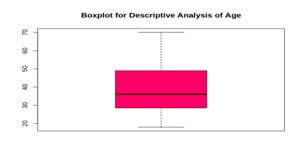
The maximum customer ages are between 30 and 35 and the minimum age of customers is 18 and the maximum age is 70.
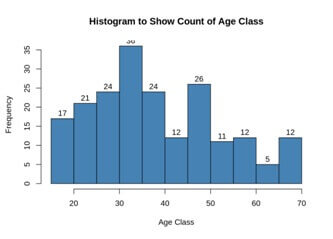
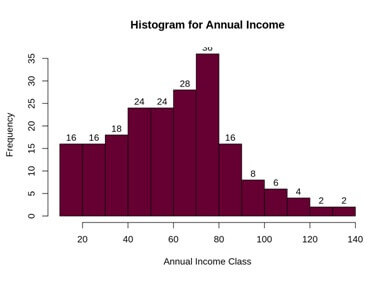
We analyze the annual income of the customers and plot a histogram.
Example
summary (customer_data$Annual.Income...k..)
hist (customer_data$Annual.Income...k..,
col="#660033",
main="Histogram for Annual Income",
xlab="Annual Income Class",
ylab="Frequency",
labels=TRUE)
Output:-
Example
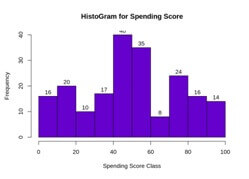
Hist (customer_data$spendng, score...1...100,
Main=”Histogram for spending score”,
Xalab=”spending scor class”,
Ylab=”frequency”,
Col=”#6600cc”,
Labels=TRUE)
Output:-
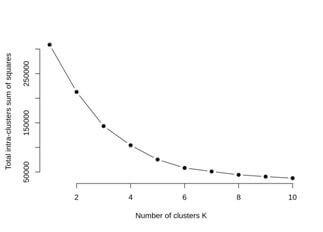
Elbow Method:-
The cluster partitioning method is like k-means is to define the clusters such that the intra-cluster variation stays minimum.
minimize (sum W (Ck)), k=1…k
The Ck represents the kth cluster and W (Ck) will denote the intra-cluster variation.
We will calculate the clustering algorithm for several values of k.
It is done by creating a variation within k from 1 to 10 clusters.
The plot denotes the number of clusters required in our model and the location of a bend.
Example
Library(purrr)
Set. Seed (123)
Iss<-function (k)
{
Kmeans (customer_data [, 3:5], k, iter.max=100, nstart=100, algorithm=”Lloyd”) $tot.withinss
}
k.values<-1:10
iss_values<-map_dbl (k.values, iss)
plot (k.values, iss_values,
type=”b”, pch=19, frame=FALSE,
xlab=”Number of clusters K”,
ylab=”Total intra-clusters sum of squares”)
Output:-
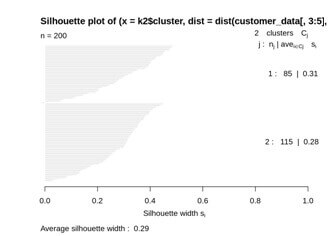
Average Silhouette Method:-
We can measure the quality of the clustering operation and determine how well within the cluster is the data object.
We obtain a high average silhouette width the means that we have good clustering.
The method will calculate the mean of silhouette observation for different k values.
We compute the average silhouette width using the k-mean function.
Example:-
library(cluster)
library(gridExtra)
library (grid)
k2<-kmeans (customer_data [, 3:5], 2, iter.max=100, nstart=50, algorithm="Lloyd")
s2<-plot (silhouette (K2$cluster, dist (customer_data [, 3:5],"euclidean")))
Output:-
Example
Kcols=function (vec) {cols=rainbow (length (unique (vec)))
Return (cols [as. numeric (as. factor (vec))])}
Digcluster<-k6$cluster<-as.character (digcluster);
Plot(pccluster$x [, 1:2], col=kcols (digcluster), pch=19, xlab=”k-means”, ylab=”classes”)
Legend(“bottomleft”.unique (dignm),
Fill=unique (kcols (digcluster)))
Output:-
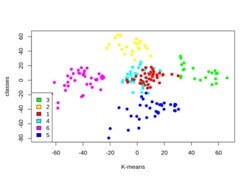
The clusters contain the medium PCA 1 and medium PCA2.
Also represent the customer having high PCA2 and low PCA1.
The fifth cluster has a customer with high PCA1 and high PCA2.
Advantages of Customer Segmentation
- It determines appropriate product pricing.
- Also develop customized marketing campaigns.
- It will design an optimal distribution strategy.
- Also choose specific product features for deployment.
- Prioritize new product development efforts.


