pie chart python pandas | pie chart pandas tutorial
The pie plot representation is the proportional representation of the numerical data in the column. The function will wrap matpotlib.pyplot.pie() for specific column. If no column is passed and the subplot is true pie plot is drawn for each numerical column. The example below has data frame information about the planet mass and the radius. We pass the mass column to pie function to get pie plot. The pie chart will show static number and how to represent part of whole composition of something.
Pie chart represents the number in percentage and total sum of all segments need to equal 100%.
pie chart python pandas Example :-
df=pd.dataframe({‘mass’:[0.33,4.87,5.97],’radius’:[243.7,605,637]},index=[‘mercury’,’venus’,’earth’])Plot=df.plot.pie(y=’mass’,figsize=(5,5))
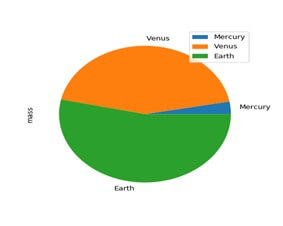
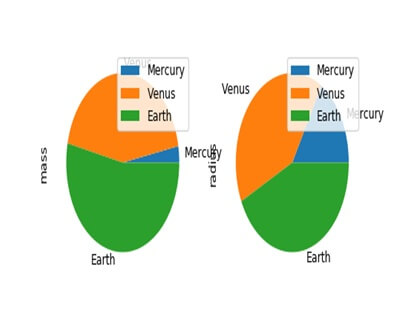
Fig:-Plot=df.plot.pie(subslots=True,figsize=(6,3))